Introduction: Google Cloud’s operations suite (formerly Stackdriver) provides comprehensive observability through Cloud Logging, Cloud Monitoring, Cloud Trace, and Error Reporting. This guide explores enterprise observability patterns, from log aggregation and custom metrics to distributed tracing and intelligent alerting. After implementing observability platforms for organizations running thousands of microservices, I’ve found GCP’s integrated approach delivers exceptional value through native service integration and powerful query capabilities. Organizations should leverage structured logging, custom metrics with labels, and SLO-based alerting while implementing proper log retention policies and cost controls from the start.
Cloud Logging Architecture: Centralized Log Management
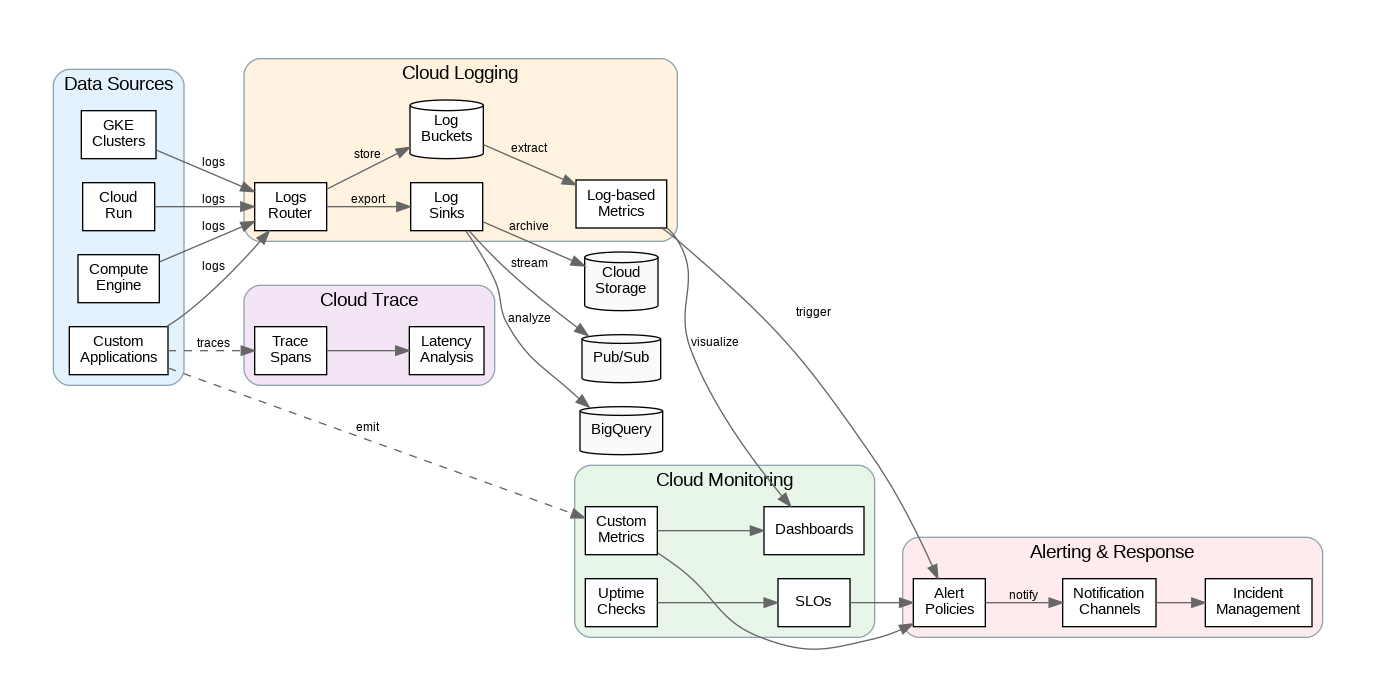
Cloud Logging automatically ingests logs from GCP services, providing a centralized view of all platform activity. Logs flow through the Logs Router, which evaluates inclusion and exclusion filters to determine destinations. By default, logs route to the _Default bucket with 30-day retention. Create custom log buckets for different retention requirements—compliance logs might need 7-year retention while debug logs need only 1 day.
Log sinks export logs to external destinations including Cloud Storage (for archival), BigQuery (for analysis), and Pub/Sub (for real-time processing). Configure sinks with filters to export only relevant logs, reducing storage costs and improving query performance. For multi-project environments, create aggregated sinks at the organization or folder level to centralize logs from all projects.
Structured logging dramatically improves searchability and analysis. Instead of unstructured text messages, emit logs as JSON with consistent field names. Cloud Logging automatically parses JSON payloads, enabling queries on specific fields. Include correlation IDs (trace IDs, request IDs) in every log entry to trace requests across services. Use severity levels consistently—ERROR for failures requiring attention, WARNING for degraded conditions, INFO for normal operations.
Cloud Monitoring: Metrics and Alerting
Cloud Monitoring collects metrics from GCP services automatically and supports custom metrics for application-specific measurements. Metrics include labels (dimensions) that enable filtering and grouping—for example, tracking latency by endpoint, region, or customer tier. Design label schemas carefully; high-cardinality labels (like user IDs) can explode metric costs and query times.
Alerting policies define conditions that trigger notifications. Move beyond simple threshold alerts to SLO-based alerting—define service level objectives (99.9% availability, p99 latency under 200ms) and alert when error budgets are at risk. This approach reduces alert fatigue by focusing on user-impacting issues rather than infrastructure metrics that may not affect service quality.
Uptime checks monitor endpoint availability from multiple global locations. Configure checks for critical endpoints with appropriate intervals (1-15 minutes) and timeout thresholds. Combine uptime checks with SSL certificate monitoring to catch expiring certificates before they cause outages. For internal services, use private uptime checks that run within your VPC.
Production Terraform Configuration
Here’s a comprehensive Terraform configuration for Cloud Logging and Monitoring with enterprise patterns:
# Cloud Operations Enterprise Configuration
terraform {
  required_version = ">= 1.5.0"
  required_providers {
    google = { source = "hashicorp/google", version = "~> 5.0" }
  }
}

variable "project_id" { type = string }
variable "notification_email" { type = string }

# Custom log bucket with extended retention
resource "google_logging_project_bucket_config" "compliance_logs" {
  project        = var.project_id
  location       = "global"
  bucket_id      = "compliance-logs"
  retention_days = 2555  # 7 years for compliance

  description = "Long-term retention for compliance and audit logs"
}

resource "google_logging_project_bucket_config" "application_logs" {
  project        = var.project_id
  location       = "global"
  bucket_id      = "application-logs"
  retention_days = 30

  description = "Application logs with standard retention"
}

# Log sink to BigQuery for analysis
resource "google_bigquery_dataset" "logs_dataset" {
  dataset_id = "application_logs"
  location   = "US"

  default_table_expiration_ms = 7776000000  # 90 days
}

resource "google_logging_project_sink" "bigquery_sink" {
  name        = "bigquery-logs-sink"
  destination = "bigquery.googleapis.com/projects/${var.project_id}/datasets/${google_bigquery_dataset.logs_dataset.dataset_id}"

  filter = <<-EOT
    resource.type="gce_instance" OR
    resource.type="cloud_run_revision" OR
    resource.type="k8s_container"
    severity >= WARNING
  EOT

  unique_writer_identity = true

  bigquery_options {
    use_partitioned_tables = true
  }
}

# Grant sink writer access to BigQuery
resource "google_bigquery_dataset_iam_member" "sink_writer" {
  dataset_id = google_bigquery_dataset.logs_dataset.dataset_id
  role       = "roles/bigquery.dataEditor"
  member     = google_logging_project_sink.bigquery_sink.writer_identity
}

# Log sink to Cloud Storage for archival
resource "google_storage_bucket" "logs_archive" {
  name     = "${var.project_id}-logs-archive"
  location = "US"

  uniform_bucket_level_access = true

  lifecycle_rule {
    condition {
      age = 365
    }
    action {
      type          = "SetStorageClass"
      storage_class = "COLDLINE"
    }
  }

  lifecycle_rule {
    condition {
      age = 2555  # 7 years
    }
    action {
      type = "Delete"
    }
  }
}

resource "google_logging_project_sink" "storage_sink" {
  name        = "storage-archive-sink"
  destination = "storage.googleapis.com/${google_storage_bucket.logs_archive.name}"

  filter = "severity >= ERROR"

  unique_writer_identity = true
}

resource "google_storage_bucket_iam_member" "sink_writer" {
  bucket = google_storage_bucket.logs_archive.name
  role   = "roles/storage.objectCreator"
  member = google_logging_project_sink.storage_sink.writer_identity
}

# Log-based metric for error rate
resource "google_logging_metric" "error_count" {
  name   = "application/error_count"
  filter = <<-EOT
    resource.type="cloud_run_revision"
    severity >= ERROR
  EOT

  metric_descriptor {
    metric_kind = "DELTA"
    value_type  = "INT64"
    unit        = "1"

    labels {
      key         = "service_name"
      value_type  = "STRING"
      description = "Cloud Run service name"
    }
  }

  label_extractors = {
    "service_name" = "EXTRACT(resource.labels.service_name)"
  }
}

# Notification channel
resource "google_monitoring_notification_channel" "email" {
  display_name = "Operations Team Email"
  type         = "email"

  labels = {
    email_address = var.notification_email
  }
}

# Uptime check for critical endpoint
resource "google_monitoring_uptime_check_config" "api_health" {
  display_name = "API Health Check"
  timeout      = "10s"
  period       = "60s"

  http_check {
    path         = "/health"
    port         = 443
    use_ssl      = true
    validate_ssl = true
  }

  monitored_resource {
    type = "uptime_url"
    labels = {
      project_id = var.project_id
      host       = "api.example.com"
    }
  }

  content_matchers {
    content = "healthy"
    matcher = "CONTAINS_STRING"
  }
}

# Alert policy for uptime check failures
resource "google_monitoring_alert_policy" "uptime_alert" {
  display_name = "API Uptime Alert"
  combiner     = "OR"

  conditions {
    display_name = "Uptime Check Failed"

    condition_threshold {
      filter          = "metric.type=\"monitoring.googleapis.com/uptime_check/check_passed\" AND resource.type=\"uptime_url\""
      duration        = "300s"
      comparison      = "COMPARISON_LT"
      threshold_value = 1

      aggregations {
        alignment_period     = "60s"
        per_series_aligner   = "ALIGN_NEXT_OLDER"
        cross_series_reducer = "REDUCE_COUNT_FALSE"
        group_by_fields      = ["resource.label.host"]
      }

      trigger {
        count = 1
      }
    }
  }

  notification_channels = [google_monitoring_notification_channel.email.id]

  alert_strategy {
    auto_close = "604800s"
  }
}

# SLO-based alert for error rate
resource "google_monitoring_alert_policy" "error_rate_alert" {
  display_name = "Error Rate SLO Alert"
  combiner     = "OR"

  conditions {
    display_name = "Error Rate Exceeds SLO"

    condition_threshold {
      filter          = "metric.type=\"logging.googleapis.com/user/${google_logging_metric.error_count.name}\""
      duration        = "300s"
      comparison      = "COMPARISON_GT"
      threshold_value = 10

      aggregations {
        alignment_period   = "60s"
        per_series_aligner = "ALIGN_RATE"
      }
    }
  }

  notification_channels = [google_monitoring_notification_channel.email.id]

  documentation {
    content   = "Error rate has exceeded the SLO threshold. Check application logs for details."
    mime_type = "text/markdown"
  }
}

# Dashboard for application metrics
resource "google_monitoring_dashboard" "application_dashboard" {
  dashboard_json = jsonencode({
    displayName = "Application Overview"
    gridLayout = {
      columns = 2
      widgets = [
        {
          title = "Request Rate"
          xyChart = {
            dataSets = [{
              timeSeriesQuery = {
                timeSeriesFilter = {
                  filter = "metric.type=\"run.googleapis.com/request_count\""
                }
              }
            }]
          }
        },
        {
          title = "Error Rate"
          xyChart = {
            dataSets = [{
              timeSeriesQuery = {
                timeSeriesFilter = {
                  filter = "metric.type=\"logging.googleapis.com/user/${google_logging_metric.error_count.name}\""
                }
              }
            }]
          }
        },
        {
          title = "Latency (p99)"
          xyChart = {
            dataSets = [{
              timeSeriesQuery = {
                timeSeriesFilter = {
                  filter = "metric.type=\"run.googleapis.com/request_latencies\""
                  aggregation = {
                    alignmentPeriod    = "60s"
                    perSeriesAligner   = "ALIGN_PERCENTILE_99"
                  }
                }
              }
            }]
          }
        }
      ]
    }
  })
}
Python SDK for Observability
This Python implementation demonstrates enterprise patterns for structured logging, custom metrics, and distributed tracing:
"""Cloud Operations Manager - Enterprise Python Implementation"""
import google.cloud.logging
from google.cloud import monitoring_v3
from google.cloud.logging_v2 import StructuredLogHandler
from opentelemetry import trace
from opentelemetry.exporter.cloud_trace import CloudTraceSpanExporter
from opentelemetry.sdk.trace import TracerProvider
from opentelemetry.sdk.trace.export import BatchSpanProcessor
import logging
import time
from functools import wraps
from typing import Dict, Any, Optional
from dataclasses import dataclass
from datetime import datetime

# Initialize structured logging
def setup_logging(project_id: str, service_name: str) -> logging.Logger:
    """Configure structured logging with Cloud Logging."""
    client = google.cloud.logging.Client(project=project_id)

    handler = StructuredLogHandler(
        labels={
            "service": service_name,
            "environment": "production"
        }
    )

    logger = logging.getLogger(service_name)
    logger.setLevel(logging.INFO)
    logger.addHandler(handler)

    return logger

# Initialize tracing
def setup_tracing(project_id: str):
    """Configure distributed tracing with Cloud Trace."""
    tracer_provider = TracerProvider()
    cloud_trace_exporter = CloudTraceSpanExporter(project_id=project_id)
    tracer_provider.add_span_processor(
        BatchSpanProcessor(cloud_trace_exporter)
    )
    trace.set_tracer_provider(tracer_provider)
    return trace.get_tracer(__name__)

@dataclass
class MetricPoint:
    name: str
    value: float
    labels: Dict[str, str]
    timestamp: datetime = None

class CloudMetricsManager:
    """Enterprise custom metrics management."""

    def __init__(self, project_id: str):
        self.project_id = project_id
        self.client = monitoring_v3.MetricServiceClient()
        self.project_name = f"projects/{project_id}"

    def create_metric_descriptor(self, metric_type: str,
                                 description: str,
                                 labels: Dict[str, str]) -> None:
        """Create custom metric descriptor."""
        descriptor = monitoring_v3.MetricDescriptor(
            type=f"custom.googleapis.com/{metric_type}",
            metric_kind=monitoring_v3.MetricDescriptor.MetricKind.GAUGE,
            value_type=monitoring_v3.MetricDescriptor.ValueType.DOUBLE,
            description=description,
            labels=[
                monitoring_v3.LabelDescriptor(
                    key=key,
                    value_type=monitoring_v3.LabelDescriptor.ValueType.STRING,
                    description=desc
                )
                for key, desc in labels.items()
            ]
        )

        self.client.create_metric_descriptor(
            name=self.project_name,
            metric_descriptor=descriptor
        )

    def write_metric(self, metric_type: str, value: float,
                    labels: Dict[str, str]) -> None:
        """Write custom metric data point."""
        series = monitoring_v3.TimeSeries()
        series.metric.type = f"custom.googleapis.com/{metric_type}"
        series.metric.labels.update(labels)

        series.resource.type = "global"
        series.resource.labels["project_id"] = self.project_id

        now = time.time()
        interval = monitoring_v3.TimeInterval(
            end_time={"seconds": int(now), "nanos": int((now % 1) * 1e9)}
        )

        point = monitoring_v3.Point(
            interval=interval,
            value=monitoring_v3.TypedValue(double_value=value)
        )
        series.points = [point]

        self.client.create_time_series(
            name=self.project_name,
            time_series=[series]
        )

    def write_batch(self, metrics: list[MetricPoint]) -> None:
        """Write multiple metrics in batch."""
        time_series = []

        for metric in metrics:
            series = monitoring_v3.TimeSeries()
            series.metric.type = f"custom.googleapis.com/{metric.name}"
            series.metric.labels.update(metric.labels)
            series.resource.type = "global"
            series.resource.labels["project_id"] = self.project_id

            ts = metric.timestamp or datetime.utcnow()
            interval = monitoring_v3.TimeInterval(
                end_time={"seconds": int(ts.timestamp())}
            )

            point = monitoring_v3.Point(
                interval=interval,
                value=monitoring_v3.TypedValue(double_value=metric.value)
            )
            series.points = [point]
            time_series.append(series)

        # Batch write (max 200 per request)
        for i in range(0, len(time_series), 200):
            batch = time_series[i:i+200]
            self.client.create_time_series(
                name=self.project_name,
                time_series=batch
            )

def traced(tracer, operation_name: str = None):
    """Decorator for automatic tracing."""
    def decorator(func):
        @wraps(func)
        def wrapper(*args, **kwargs):
            name = operation_name or func.__name__
            with tracer.start_as_current_span(name) as span:
                span.set_attribute("function.name", func.__name__)
                try:
                    result = func(*args, **kwargs)
                    span.set_attribute("function.success", True)
                    return result
                except Exception as e:
                    span.set_attribute("function.success", False)
                    span.set_attribute("error.message", str(e))
                    span.record_exception(e)
                    raise
        return wrapper
    return decorator

def timed_metric(metrics_manager: CloudMetricsManager,
                metric_name: str,
                labels: Dict[str, str] = None):
    """Decorator for automatic latency metrics."""
    def decorator(func):
        @wraps(func)
        def wrapper(*args, **kwargs):
            start = time.time()
            try:
                result = func(*args, **kwargs)
                success = True
                return result
            except Exception as e:
                success = False
                raise
            finally:
                duration = (time.time() - start) * 1000  # ms
                metric_labels = labels or {}
                metric_labels["success"] = str(success).lower()
                metrics_manager.write_metric(
                    f"{metric_name}/latency",
                    duration,
                    metric_labels
                )
        return wrapper
    return decorator
Cost Optimization and Best Practices
Cloud Logging charges per GB ingested after the free tier (50GB/month). Implement exclusion filters to drop verbose logs that provide little value—debug logs, health check requests, and routine operational messages. Route high-volume logs directly to Cloud Storage (cheaper than log buckets) if you only need them for compliance rather than real-time querying.
Custom metrics pricing depends on the number of time series (unique label combinations) and data points written. Avoid high-cardinality labels that create millions of time series. Use metric aggregation at the application level when possible—emit pre-aggregated percentiles rather than individual request latencies. Review metric usage regularly and delete unused metric descriptors.
Implement log sampling for high-volume services. Sample 10% of successful requests while logging 100% of errors. Use trace-based sampling to ensure complete request traces even with sampling enabled. Configure appropriate retention periods—30 days for operational logs, longer only for compliance requirements.
Key Takeaways and Best Practices
GCP’s operations suite provides comprehensive observability through integrated logging, monitoring, and tracing. Implement structured logging with consistent field names and correlation IDs from the start. Use log-based metrics to bridge logging and monitoring, enabling alerts on log patterns without custom instrumentation.
Move beyond threshold-based alerting to SLO-based approaches that focus on user-impacting issues. Design metric label schemas carefully to avoid cardinality explosions. The Terraform and Python examples provided here establish patterns for production-ready observability that scales from single services to thousands of microservices while maintaining cost efficiency.
Discover more from C4: Container, Code, Cloud & Context
Subscribe to get the latest posts sent to your email.