
Observability has become the cornerstone of successful cloud operations, and after two decades of building and maintaining enterprise systems, I can confidently say that Azure Monitor represents one of the most comprehensive observability platforms available today. The ability to collect, analyze, and act on telemetry data from across your entire Azure estate—and beyond—transforms how organizations approach operational excellence.
The Three Pillars of Observability
Azure Monitor unifies the three pillars of observability—metrics, logs, and traces—into a single platform. Metrics provide real-time numerical data about resource performance, enabling quick detection of anomalies and trends. Logs capture detailed event information that supports deep investigation and root cause analysis. Distributed traces follow requests across service boundaries, revealing the complete journey of transactions through complex microservices architectures.
This unified approach eliminates the fragmentation that plagued earlier monitoring solutions. Instead of correlating data across multiple disconnected tools, Azure Monitor provides a single pane of glass where metrics, logs, and traces can be analyzed together. When an alert fires based on a metric threshold, you can immediately pivot to related logs and traces without switching contexts or tools.

Data Collection Architecture
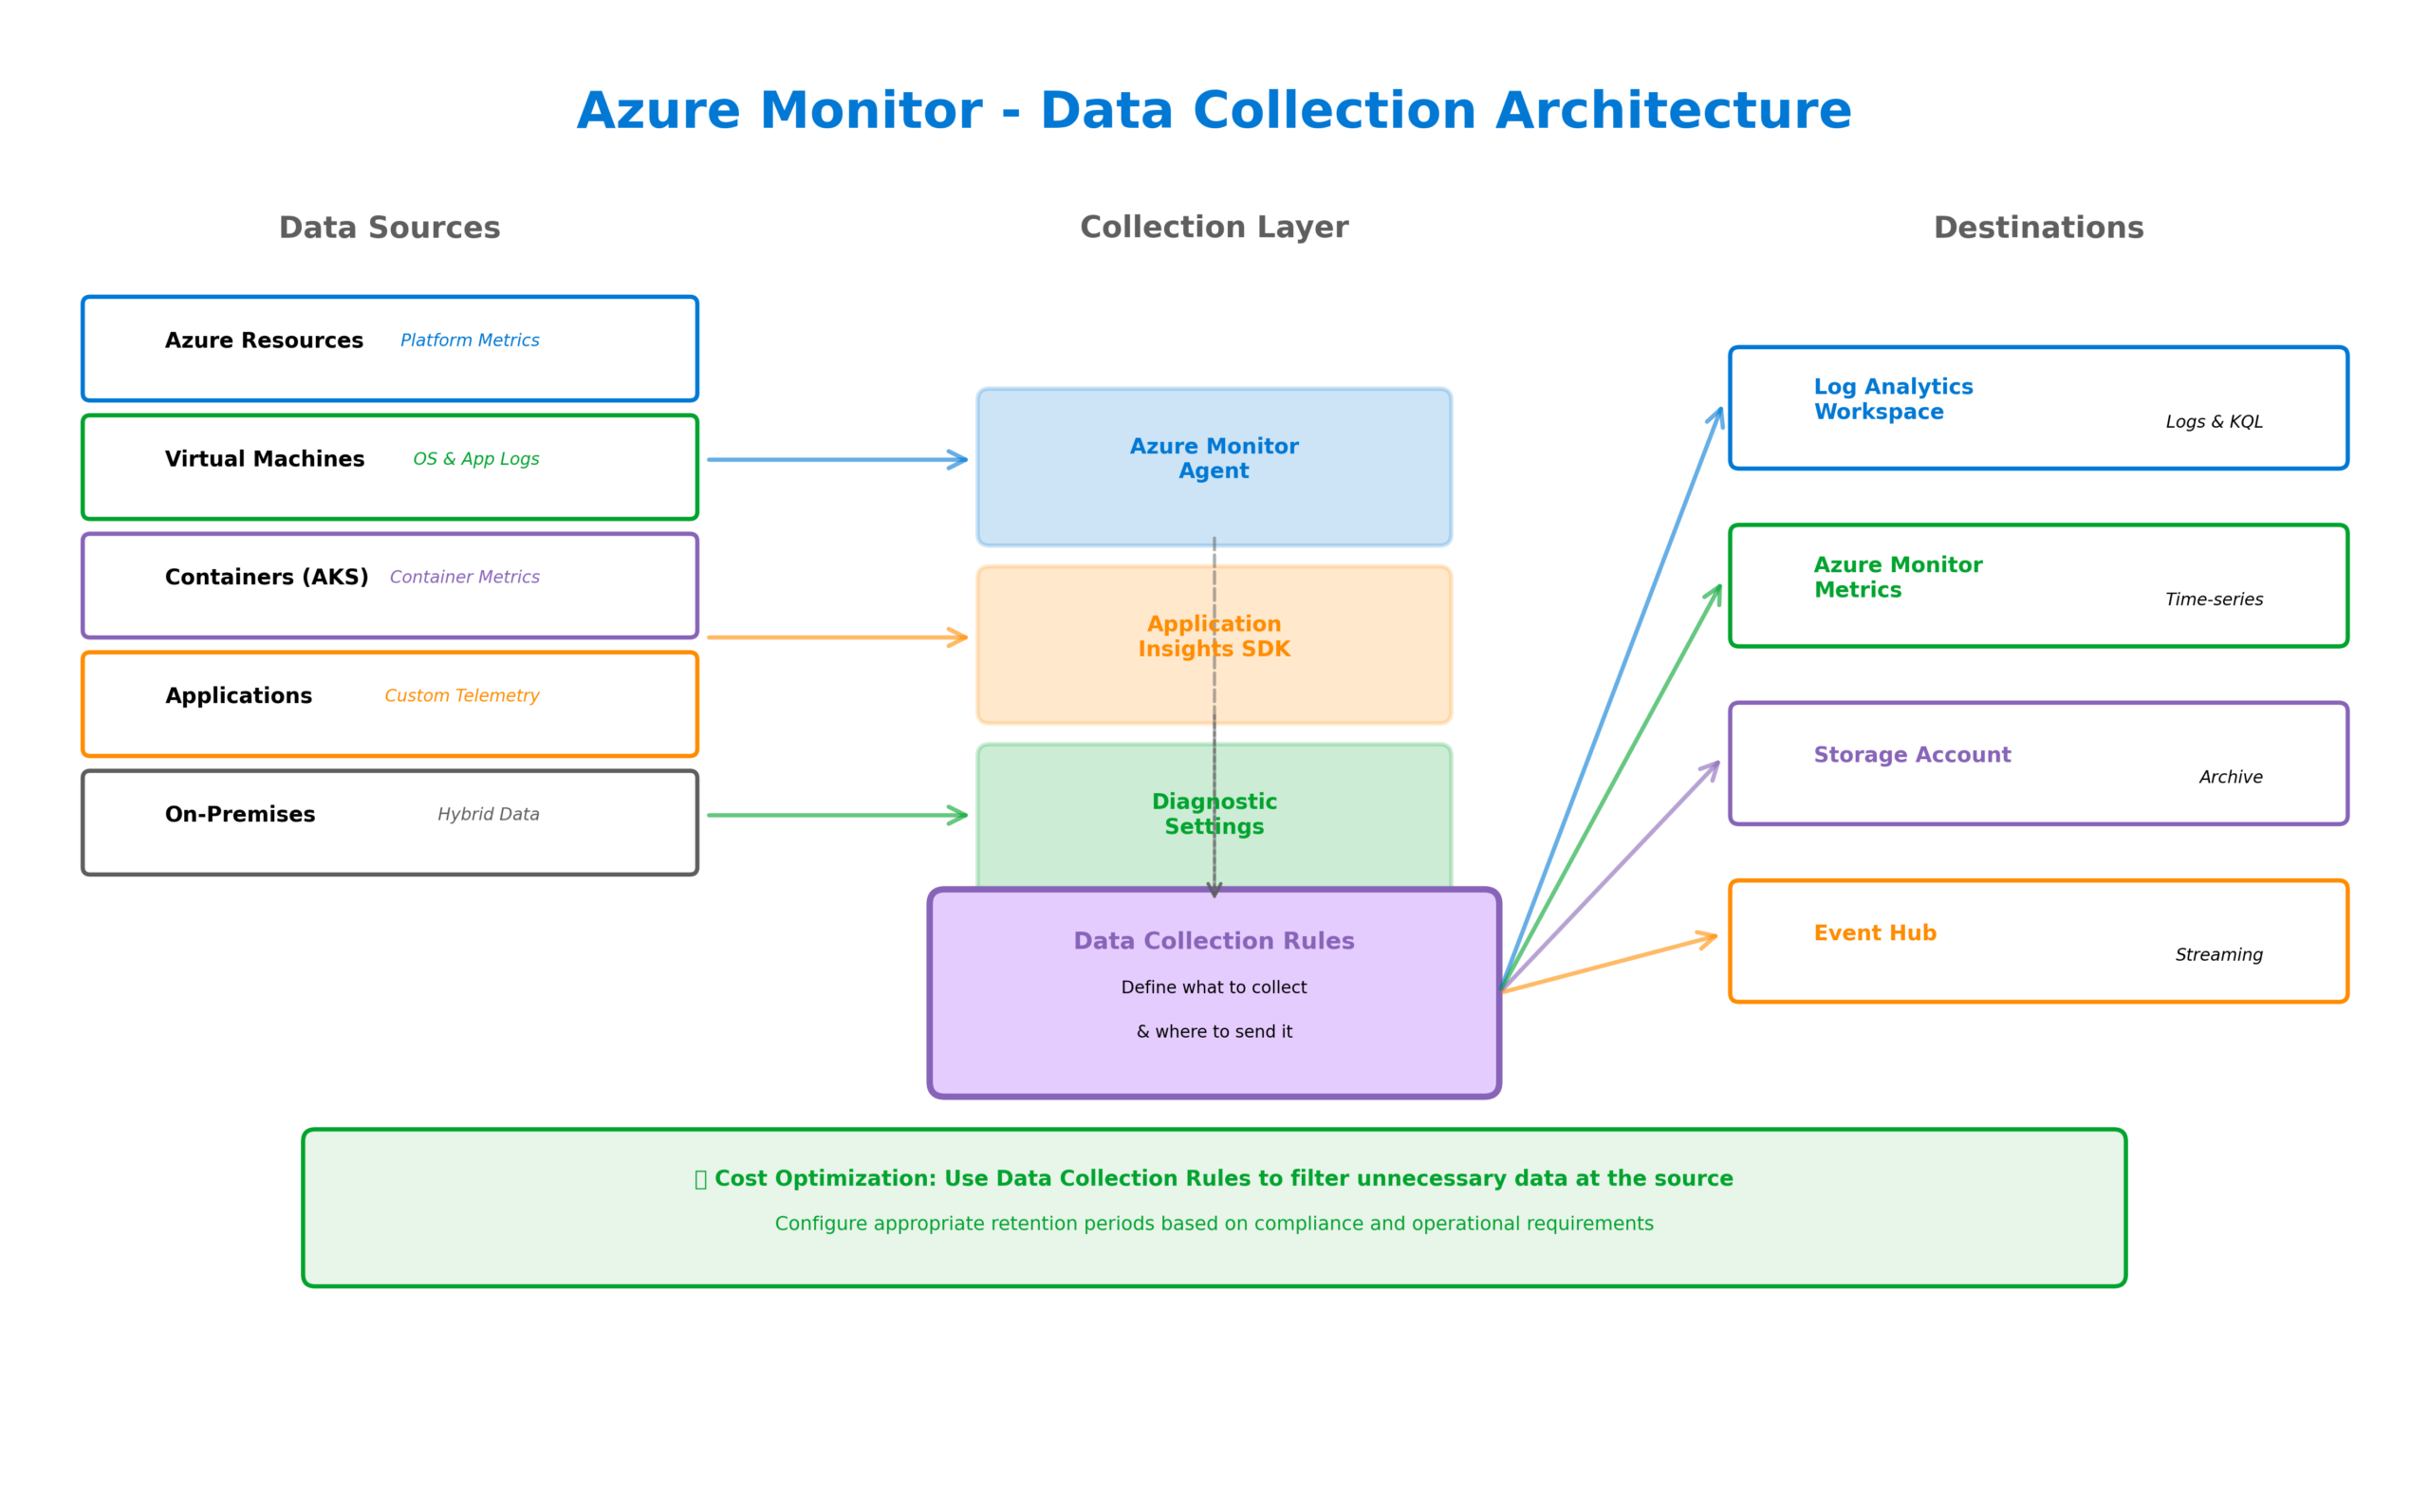
Azure Monitor collects telemetry from multiple sources through various mechanisms. Platform metrics flow automatically from Azure resources without any configuration—CPU utilization, memory consumption, network throughput, and hundreds of other metrics are captured by default. Resource logs require explicit configuration through diagnostic settings, directing detailed operational data to Log Analytics workspaces, storage accounts, or Event Hubs.
For virtual machines and containers, the Azure Monitor Agent provides comprehensive data collection. This unified agent replaces the legacy Log Analytics agent and Azure Diagnostics extension, simplifying deployment while expanding capabilities. Data Collection Rules define exactly what data to collect and where to send it, enabling granular control over telemetry ingestion costs.
Application Insights extends monitoring into your application code. Through auto-instrumentation or SDK integration, it captures request rates, response times, failure rates, dependency calls, and custom telemetry. The distributed tracing capabilities track requests across service boundaries, essential for understanding behavior in microservices architectures.
Log Analytics and KQL
The Log Analytics workspace serves as the central repository for log data in Azure Monitor. Understanding Kusto Query Language (KQL) unlocks the full analytical power of this platform. KQL’s pipe-based syntax enables complex queries that filter, aggregate, join, and visualize data with remarkable efficiency.
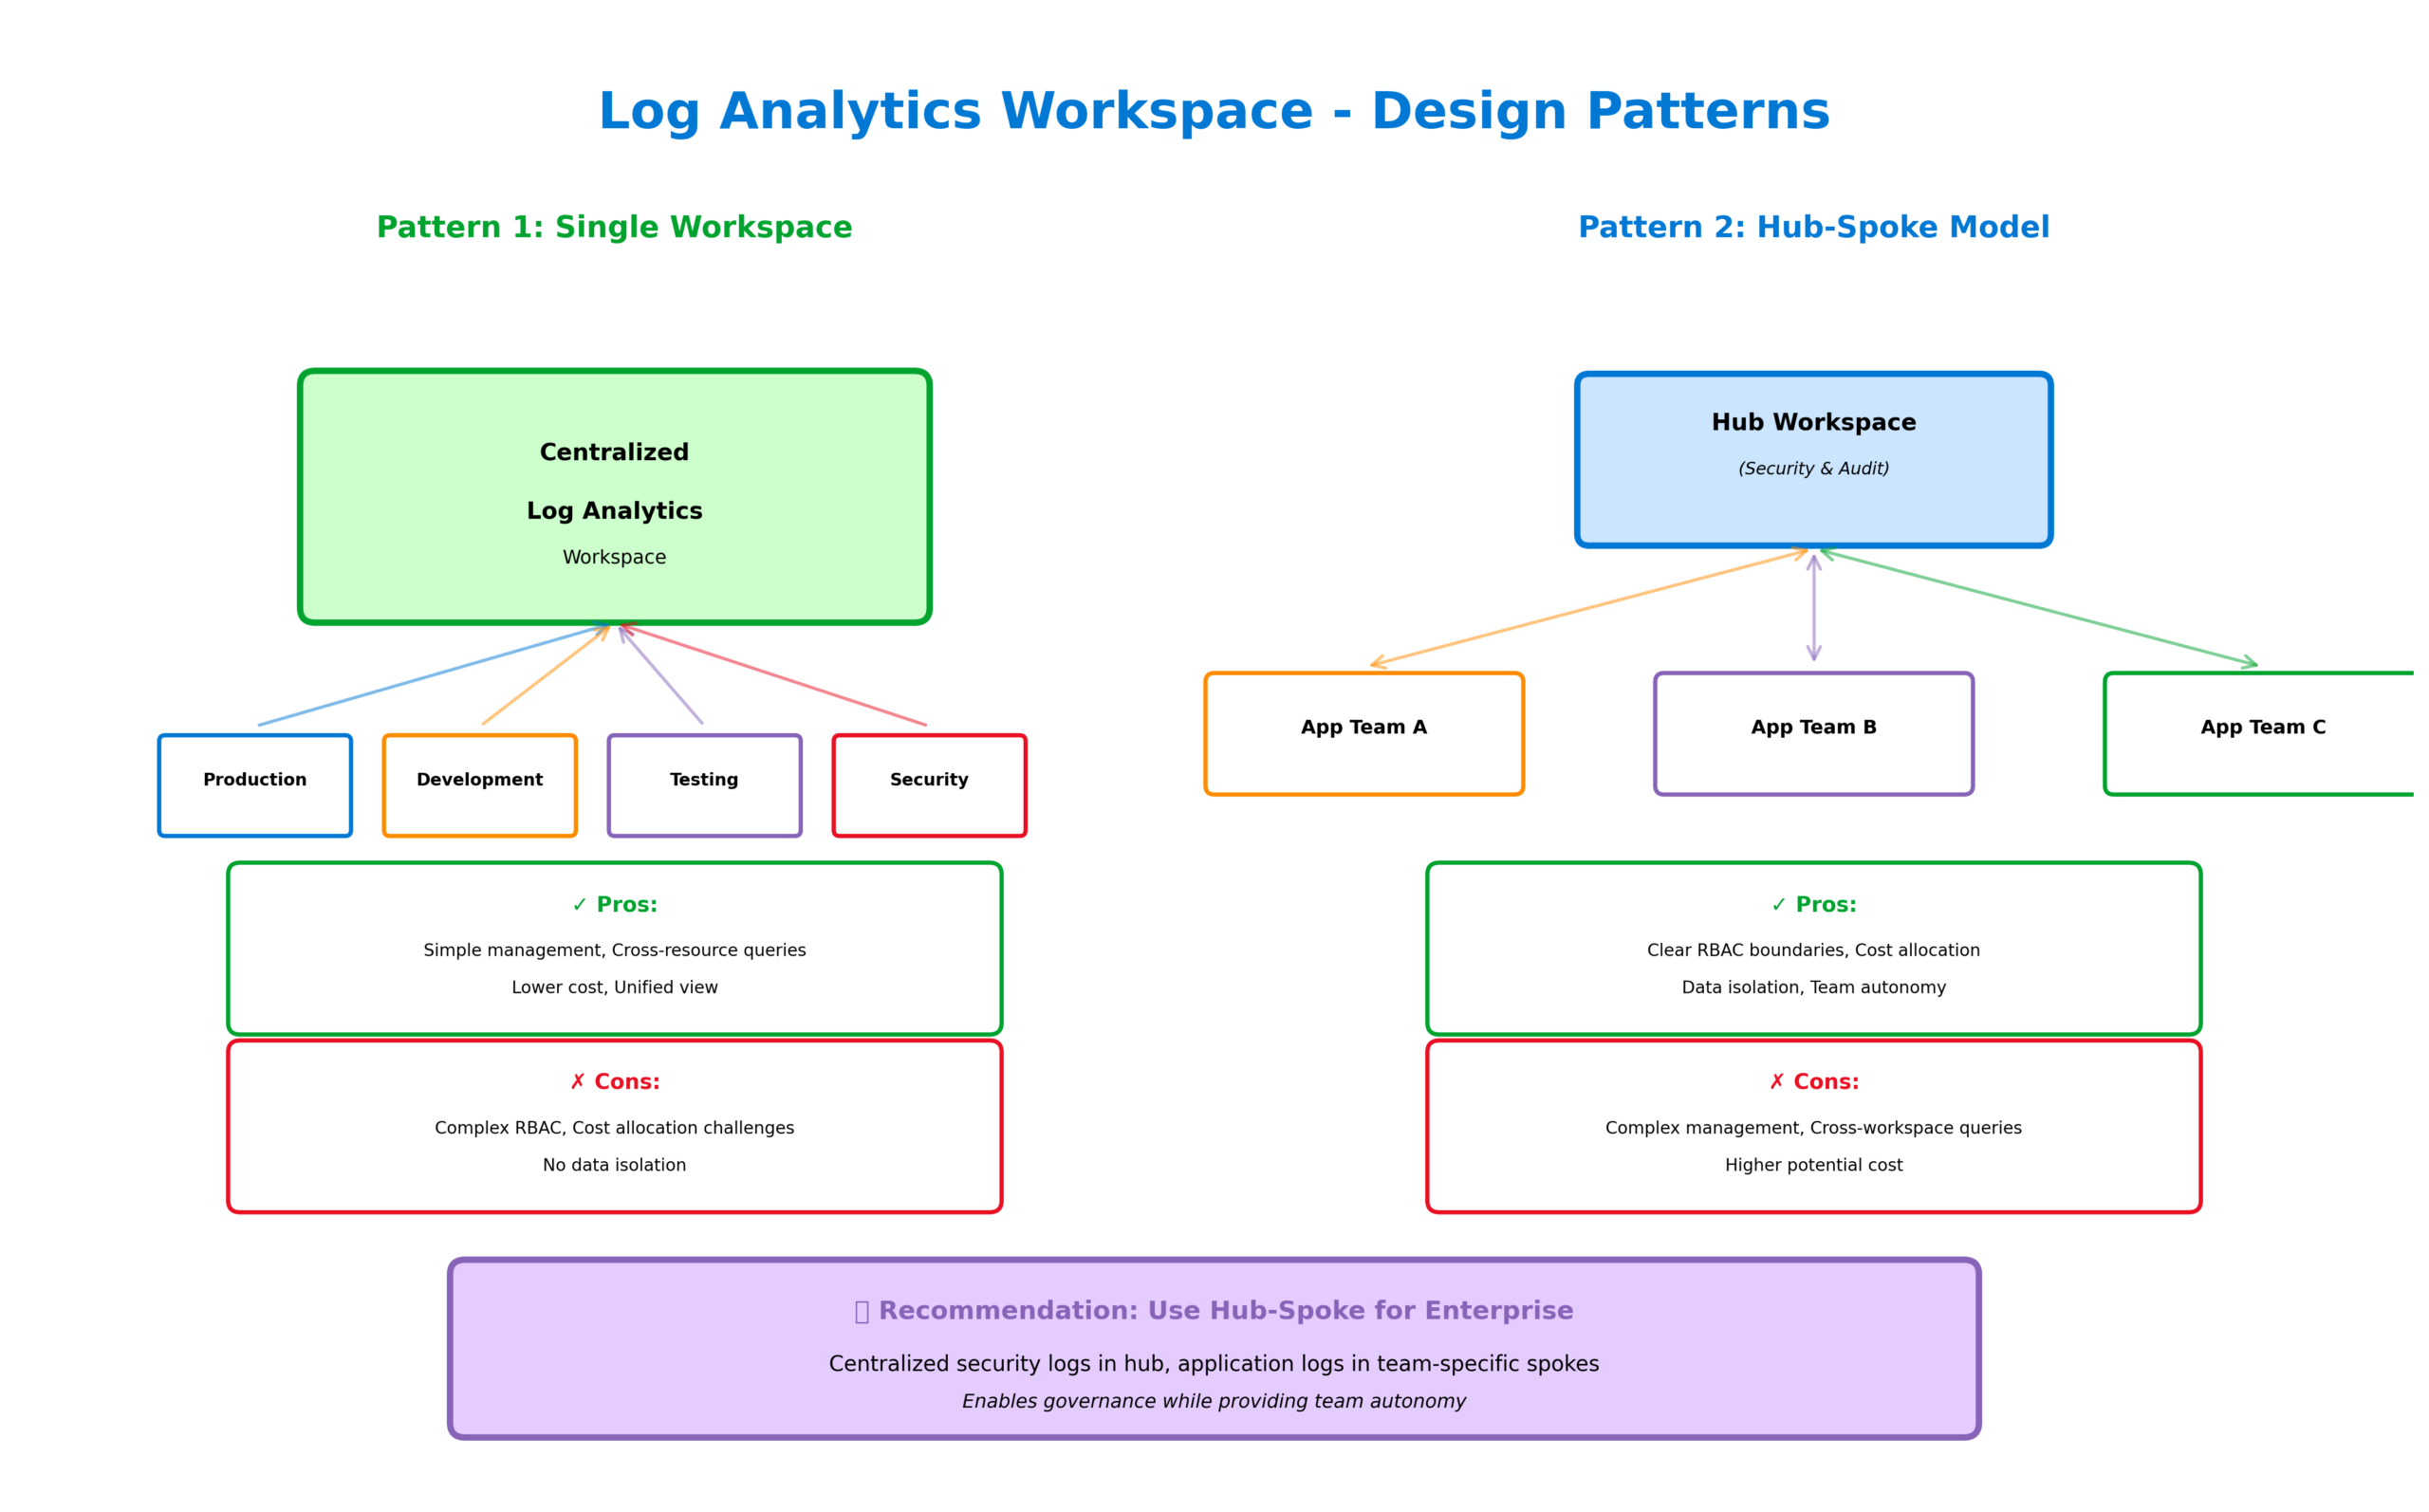
Effective log management requires thoughtful workspace design. Single workspace architectures simplify management and enable cross-resource correlation but may create challenges around access control and cost allocation. Multiple workspace designs provide better isolation and governance but complicate queries that span resources. Most enterprise deployments land somewhere in between, using a hub workspace for centralized security logs and spoke workspaces for application teams.
Azure Monitor Insights
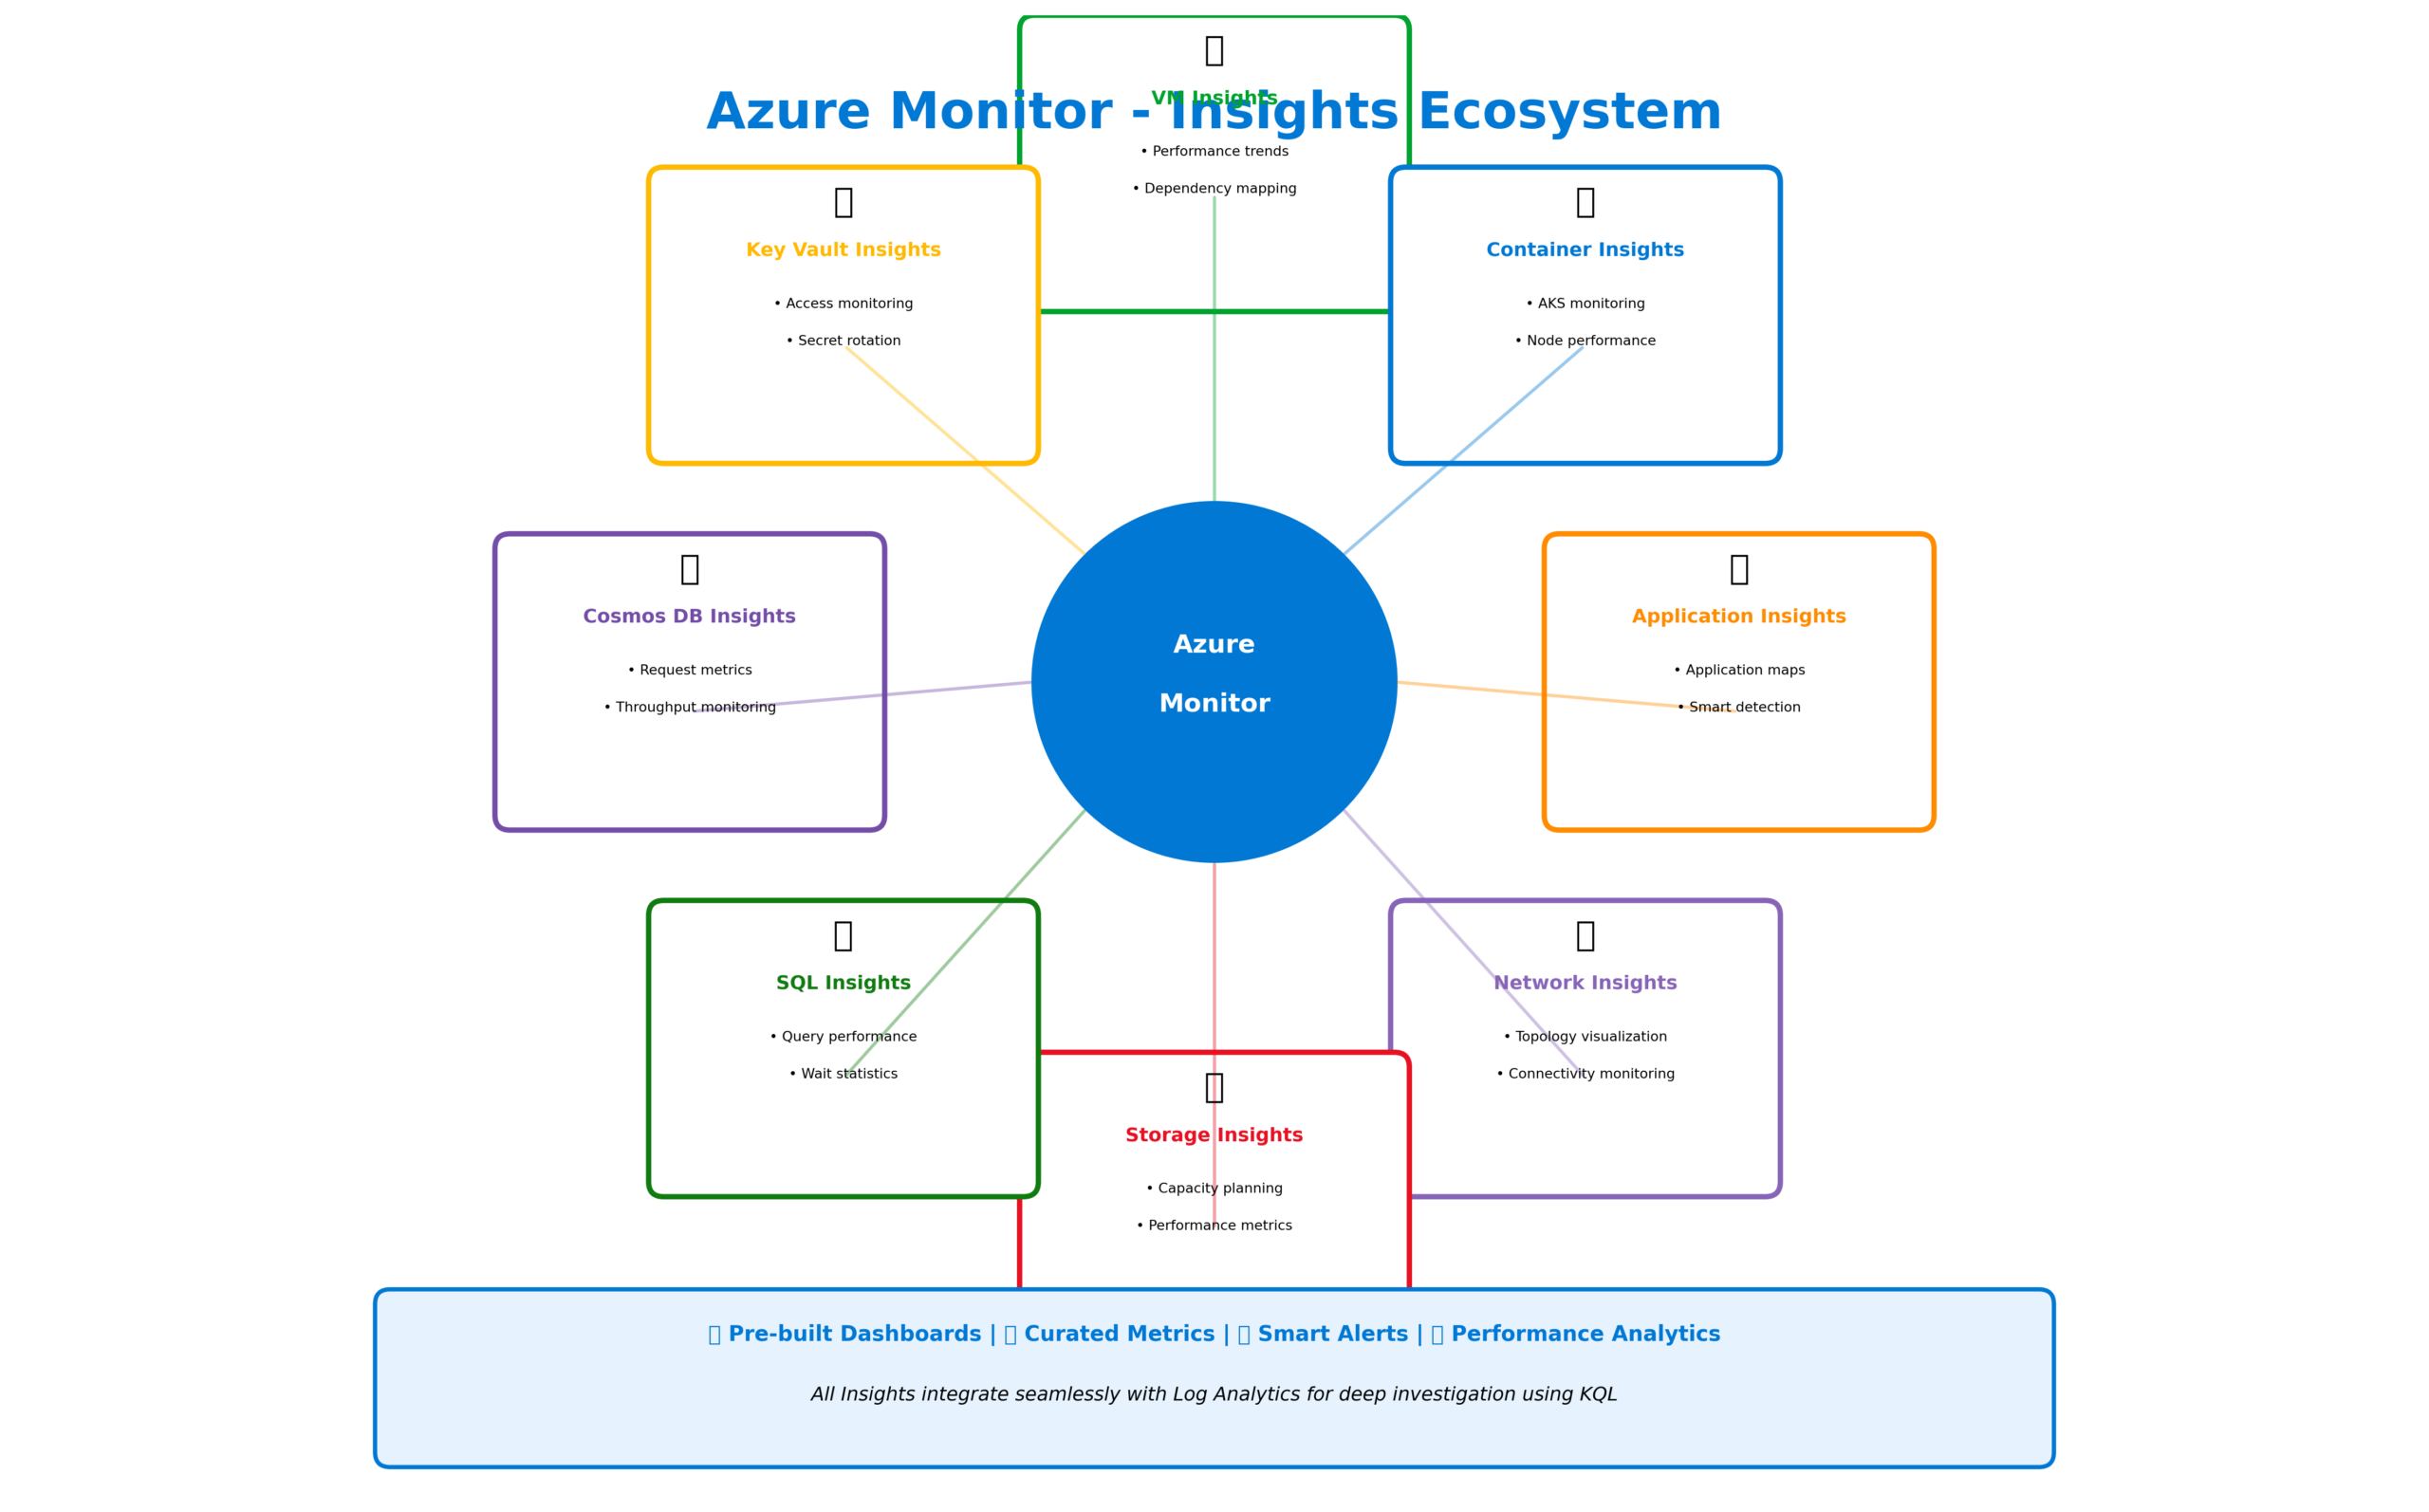
Azure Monitor Insights provide curated monitoring experiences for specific resource types. VM Insights delivers comprehensive virtual machine monitoring including performance trends, dependency mapping, and health state. Container Insights monitors AKS clusters with pre-built dashboards for node performance, pod health, and container metrics. Network Insights visualizes network topology and identifies connectivity issues across your Azure infrastructure.
Application Insights deserves special attention as the most feature-rich of the Insights offerings. Beyond basic telemetry collection, it provides application maps that visualize dependencies, smart detection that automatically identifies anomalies, and availability tests that probe your applications from locations worldwide. The Live Metrics feature streams real-time telemetry during incident investigation, showing exactly what’s happening in your application right now.
Alerting and Automation
Azure Monitor’s alerting system transforms passive monitoring into active incident management. Alert rules evaluate conditions against metrics or log queries, firing when thresholds are breached. Action groups define the response—sending notifications via email, SMS, or push notifications, calling webhooks, triggering Logic Apps, or executing Azure Functions.
Smart alert grouping reduces noise by correlating related alerts into single incidents. Alert processing rules provide additional control, suppressing alerts during maintenance windows or routing them based on resource tags. The integration with IT Service Management tools enables automatic ticket creation in ServiceNow, PagerDuty, or other platforms.
Autoscale leverages Azure Monitor metrics to automatically adjust resource capacity. When CPU utilization exceeds thresholds, additional instances spin up to handle load. When demand subsides, instances scale back down to optimize costs. This reactive scaling, combined with scheduled scaling for predictable patterns, ensures applications remain responsive while minimizing infrastructure spend.

When to Use What
Choosing the right Azure Monitor components depends on your specific requirements. Use metrics for real-time performance monitoring and alerting on numerical thresholds—they’re fast, cost-effective, and ideal for dashboards. Use logs when you need detailed investigation capabilities, complex queries, or long-term retention of operational data. Use Application Insights for any custom application where you need visibility into code-level behavior and user experience.
For visualization, Azure Dashboards provide quick, shareable views of key metrics. Workbooks offer more sophisticated reporting with interactive parameters and rich formatting. Azure Managed Grafana integrates the popular open-source visualization platform for teams already familiar with Grafana’s capabilities.
Implementation Best Practices
Successful Azure Monitor implementations follow several key practices. First, establish a tagging strategy that enables cost allocation and access control. Tags on resources flow through to monitoring data, enabling queries and alerts scoped to specific applications, environments, or cost centers.
Second, implement monitoring through infrastructure as code. Diagnostic settings, alert rules, and action groups should be defined in ARM templates, Bicep, or Terraform alongside the resources they monitor. This ensures monitoring is never an afterthought and changes are tracked through version control.
Third, design for cost optimization from the start. Log Analytics pricing is based on data ingestion, so understanding what data you actually need prevents unexpected bills. Use data collection rules to filter unnecessary data at the source, and configure appropriate retention periods based on compliance and operational requirements.
Looking Forward
Azure Monitor continues to evolve with capabilities that address emerging enterprise requirements. The integration with Azure OpenAI enables natural language queries against monitoring data, making insights accessible to broader audiences. Enhanced AIOps capabilities automatically detect anomalies and suggest root causes. The convergence with Microsoft Sentinel provides unified security and operational monitoring.
For solutions architects, mastering Azure Monitor means understanding not just the technical capabilities but also the operational patterns that leverage them effectively. Whether you’re monitoring a simple web application or a complex distributed system, comprehensive observability forms the foundation for reliable, performant, and cost-effective cloud operations.
Discover more from C4: Container, Code, Cloud & Context
Subscribe to get the latest posts sent to your email.